Set report · United States · Dollars
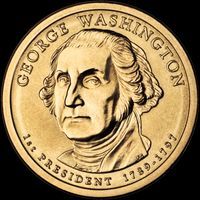
Presidential Dollar: Who Owns What
How often each Presidential Dollar coin actually turns up in a collection, measured by how many of the 3,610 collectors of this set have one. Coins are graded from Common to Extremely scarce against the set's most-owned coin — a measure of collecting frequency, not of how many survive.
Hardest to find in real collections
The five least-owned coins of the set — ownership counts are collector-reported.
…and the ones everybody has
Full set: ownership & rarity, coin by coin
Values by grade for each of these live on the Presidential Dollar catalog pages and the full price guide.
| Coin | Mintage | Collectors | % of set collectors | How often collected |
|---|---|---|---|---|
| 2007-D George Washington | — | 1,543 | 42.7% | Common |
| 2007-D James Madison | — | 1,108 | 30.7% | Uncommon |
| 2007-D John Adams | — | 1,231 | 34.1% | Uncommon |
| 2007-D Thomas Jefferson | — | 1,167 | 32.3% | Uncommon |
| 2007-P George Washington | — | 1,793 | 49.7% | Common |
| 2007-P James Madison | — | 1,163 | 32.2% | Uncommon |
| 2007-P John Adams | — | 1,333 | 36.9% | Uncommon |
| 2007-P Thomas Jefferson | — | 1,270 | 35.2% | Uncommon |
| 2007-S George Washington (Proof) | — | 178 | 4.9% | Extremely scarce |
| 2007-S James Madison (Proof) | — | 170 | 4.7% | Extremely scarce |
| 2007-S John Adams (Proof) | — | 168 | 4.7% | Extremely scarce |
| 2007-S Thomas Jefferson (Proof) | — | 164 | 4.5% | Extremely scarce |
| 2008-D Andrew Jackson | — | 957 | 26.5% | Uncommon |
| 2008-D James Monroe | — | 947 | 26.2% | Uncommon |
| 2008-D John Quincy Adams | — | 951 | 26.3% | Uncommon |
| 2008-D Martin Van Buren | — | 858 | 23.8% | Scarce |
| 2008-P Andrew Jackson | — | 999 | 27.7% | Uncommon |
| 2008-P James Monroe | — | 1,052 | 29.1% | Uncommon |
| 2008-P John Quincy Adams | — | 950 | 26.3% | Uncommon |
| 2008-P Martin Van Buren | — | 960 | 26.6% | Uncommon |
| 2008-S Andrew Jackson (Proof) | — | 137 | 3.8% | Extremely scarce |
| 2008-S James Monroe (Proof) | — | 143 | 4% | Extremely scarce |
| 2008-S John Quincy Adams (Proof) | — | 141 | 3.9% | Extremely scarce |
| 2008-S Martin Van Buren (Proof) | — | 138 | 3.8% | Extremely scarce |
| 2009-D James K Polk | — | 855 | 23.7% | Scarce |
| 2009-D John Tyler | — | 870 | 24.1% | Scarce |
| 2009-D William Henry Harrison | — | 935 | 25.9% | Uncommon |
| 2009-D Zachary Taylor | — | 820 | 22.7% | Scarce |
| 2009-P James K Polk | — | 911 | 25.2% | Uncommon |
| 2009-P John Tyler | — | 890 | 24.7% | Scarce |
| 2009-P William Henry Harrison | — | 907 | 25.1% | Uncommon |
| 2009-P Zachary Taylor | — | 893 | 24.7% | Scarce |
| 2009-S James K Polk (Proof) | — | 156 | 4.3% | Extremely scarce |
| 2009-S John Tyler (Proof) | — | 150 | 4.2% | Extremely scarce |
| 2009-S William Henry Harrison (Proof) | — | 146 | 4% | Extremely scarce |
| 2009-S Zachary Taylor (Proof) | — | 151 | 4.2% | Extremely scarce |
| 2010-D Abraham Lincoln | — | 938 | 26% | Uncommon |
| 2010-D Franklin Pierce | — | 814 | 22.5% | Scarce |
| 2010-D James Buchanan | — | 824 | 22.8% | Scarce |
| 2010-D Millard Fillmore | — | 819 | 22.7% | Scarce |
| 2010-P Abraham Lincoln | — | 974 | 27% | Uncommon |
| 2010-P Franklin Pierce | — | 877 | 24.3% | Scarce |
| 2010-P James Buchanan | — | 846 | 23.4% | Scarce |
| 2010-P Millard Fillmore | — | 851 | 23.6% | Scarce |
| 2010-S Abraham Lincoln (Proof) | — | 144 | 4% | Extremely scarce |
| 2010-S Franklin Pierce (Proof) | — | 121 | 3.4% | Extremely scarce |
| 2010-S James Buchanan (Proof) | — | 129 | 3.6% | Extremely scarce |
| 2010-S Millard Fillmore (Proof) | — | 128 | 3.5% | Extremely scarce |
| 2011-D Andrew Johnson | — | 832 | 23% | Scarce |
| 2011-D James A Garfield | — | 837 | 23.2% | Scarce |
| 2011-D Rutherford B Hayes | — | 854 | 23.7% | Scarce |
| 2011-D Ulysses S Grant | — | 812 | 22.5% | Scarce |
| 2011-P Andrew Johnson | — | 841 | 23.3% | Scarce |
| 2011-P James A Garfield | — | 872 | 24.2% | Scarce |
| 2011-P Rutherford B Hayes | — | 832 | 23% | Scarce |
| 2011-P Ulysses S Grant | — | 844 | 23.4% | Scarce |
| 2011-S Andrew Johnson (Proof) | — | 114 | 3.2% | Extremely scarce |
| 2011-S James A Garfield (Proof) | — | 115 | 3.2% | Extremely scarce |
| 2011-S Rutherford B Hayes (Proof) | — | 115 | 3.2% | Extremely scarce |
| 2011-S Ulysses S Grant (Proof) | — | 120 | 3.3% | Extremely scarce |
| 2012-D Benjamin Harrison | — | 423 | 11.7% | Very scarce |
| 2012-D Chester A Arthur | — | 447 | 12.4% | Very scarce |
| 2012-D Grover Cleveland | — | 442 | 12.2% | Very scarce |
| 2012-D Grover Cleveland 2 | — | 411 | 11.4% | Very scarce |
| 2012-P Benjamin Harrison | — | 483 | 13.4% | Scarce |
| 2012-P Chester A Arthur | — | 516 | 14.3% | Scarce |
| 2012-P Grover Cleveland | — | 514 | 14.2% | Scarce |
| 2012-P Grover Cleveland 2 | — | 457 | 12.7% | Very scarce |
| 2012-S Benjamin Harrison (Proof) | — | 92 | 2.5% | Extremely scarce |
| 2012-S Chester A Arthur (Proof) | — | 94 | 2.6% | Extremely scarce |
| 2012-S Grover Cleveland (Proof) | — | 93 | 2.6% | Extremely scarce |
| 2012-S Grover Cleveland 2 (Proof) | — | 90 | 2.5% | Extremely scarce |
| 2013-D Theodore Roosevelt | — | 403 | 11.2% | Very scarce |
| 2013-D William Howard Taft | — | 386 | 10.7% | Very scarce |
| 2013-D William McKinley | — | 402 | 11.1% | Very scarce |
| 2013-D Woodrow Wilson | — | 405 | 11.2% | Very scarce |
| 2013-P Theodore Roosevelt | — | 473 | 13.1% | Scarce |
| 2013-P William Howard Taft | — | 457 | 12.7% | Very scarce |
| 2013-P William McKinley | — | 462 | 12.8% | Scarce |
| 2013-P Woodrow Wilson | — | 440 | 12.2% | Very scarce |
| 2013-S Theodore Roosevelt (Proof) | — | 98 | 2.7% | Extremely scarce |
| 2013-S William Howard Taft (Proof) | — | 99 | 2.7% | Extremely scarce |
| 2013-S William McKinley (Proof) | — | 97 | 2.7% | Extremely scarce |
| 2013-S Woodrow Wilson (Proof) | — | 91 | 2.5% | Extremely scarce |
| 2014-D Calvin Coolidge | — | 388 | 10.7% | Very scarce |
| 2014-D Franklin D Roosevelt | — | 409 | 11.3% | Very scarce |
| 2014-D Herbert Hoover | — | 390 | 10.8% | Very scarce |
| 2014-D Warren G Harding | — | 384 | 10.6% | Very scarce |
| 2014-P Calvin Coolidge | — | 443 | 12.3% | Very scarce |
| 2014-P Franklin D Roosevelt | — | 452 | 12.5% | Very scarce |
| 2014-P Herbert Hoover | — | 437 | 12.1% | Very scarce |
| 2014-P Warren G Harding | — | 439 | 12.2% | Very scarce |
| 2014-S Calvin Coolidge (Proof) | — | 97 | 2.7% | Extremely scarce |
| 2014-S Franklin D Roosevelt (Proof) | — | 106 | 2.9% | Extremely scarce |
| 2014-S Herbert Hoover (Proof) | — | 101 | 2.8% | Extremely scarce |
| 2014-S Warren G Harding (Proof) | — | 101 | 2.8% | Extremely scarce |
| 2015-D Dwight D Eisenhower | — | 424 | 11.7% | Very scarce |
| 2015-D Harry S Truman | — | 403 | 11.2% | Very scarce |
| 2015-D John F Kennedy | — | 453 | 12.5% | Very scarce |
| 2015-D Lyndon B Johnson | — | 397 | 11% | Very scarce |
| 2015-P Dwight D Eisenhower | — | 441 | 12.2% | Very scarce |
| 2015-P Harry S Truman | — | 462 | 12.8% | Scarce |
| 2015-P John F Kennedy | — | 491 | 13.6% | Scarce |
| 2015-P Lyndon B Johnson | — | 444 | 12.3% | Very scarce |
| 2015-P Dwight D Eisenhower Reverse (Proof) | — | 56 | 1.6% | Extremely scarce |
| 2015-P Harry S Truman Reverse (Proof) | — | 64 | 1.8% | Extremely scarce |
| 2015-P John F Kennedy Reverse (Proof) | — | 51 | 1.4% | Extremely scarce |
| 2015-P Lyndon B Johnson Reverse (Proof) | — | 42 | 1.2% | Extremely scarce |
| 2015-S Dwight D Eisenhower (Proof) | — | 100 | 2.8% | Extremely scarce |
| 2015-S Harry S Truman (Proof) | — | 96 | 2.7% | Extremely scarce |
| 2015-S John F Kennedy (Proof) | — | 94 | 2.6% | Extremely scarce |
| 2015-S Lyndon B Johnson (Proof) | — | 101 | 2.8% | Extremely scarce |
| 2016-D Gerald Ford | — | 427 | 11.8% | Very scarce |
| 2016-D Richard Nixon | — | 430 | 11.9% | Very scarce |
| 2016-D Ronald Reagan | — | 438 | 12.1% | Very scarce |
| 2016-P Gerald Ford | — | 445 | 12.3% | Very scarce |
| 2016-P Richard Nixon | — | 456 | 12.6% | Very scarce |
| 2016-P Ronald Reagan | — | 480 | 13.3% | Scarce |
| 2016-P Ronald Reagan Reverse (Proof) | — | 52 | 1.4% | Extremely scarce |
| 2016-S Gerald Ford (Proof) | — | 93 | 2.6% | Extremely scarce |
| 2016-S Richard Nixon (Proof) | — | 94 | 2.6% | Extremely scarce |
| 2016-S Ronald Reagan (Proof) | — | 93 | 2.6% | Extremely scarce |
| 2020-D George H W Bush | — | 398 | 11% | Very scarce |
| 2020-P George H W Bush | — | 383 | 10.6% | Very scarce |
| 2020-S George H W Bush (Proof) | — | 37 | 1% | Extremely scarce |
| 2020-S George H W Bush Reverse (Proof) | — | 4 | 0.1% | Extremely scarce |
- Common
- Uncommon
- Scarce
- Very scarce
- Extremely scarce
Based on the share of this set's collectors who own each coin — how often it turns up in a collection, not how many survive. Not the Sheldon rarity scale.
About these numbers
Ownership counts come from the same live per-coin counters shown across the LuckyCoin catalog; set-level collector counts come from the annual full-collection scan behind The State of Coin Collecting 2026. Counts are collector-reported and aggregate-only. Scarcity tiers come from 100 × (1 − owners ÷ owners of the set's most-owned coin): Common under 25, Uncommon 25–49, Scarce 50–74, Very scarce 75–89, Extremely scarce 90+. This reflects how often a coin is collected, not its surviving population — it is not the Sheldon rarity scale. CC BY 4.0 with attribution.