Set report · United States · Twenty Cents and Quarters
America the Beautiful Quarters: Who Owns What
How often each America the Beautiful Quarters coin actually turns up in a collection, measured by how many of the 4,500 collectors of this set have one. Coins are graded from Common to Extremely scarce against the set's most-owned coin — a measure of collecting frequency, not of how many survive.
Hardest to find in real collections
The five least-owned coins of the set — ownership counts are collector-reported.
…and the ones everybody has
Full set: ownership & rarity, coin by coin
Values by grade for each of these live on the America the Beautiful Quarters catalog pages and the full price guide.
| Coin | Mintage | Collectors | % of set collectors | How often collected |
|---|---|---|---|---|
| 2010-D Grand Canyon | — | 1,021 | 22.7% | Uncommon |
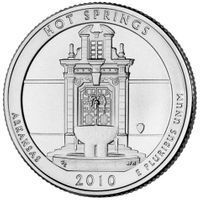
| 2010-D Hot Springs | — | 1,128 | 25.1% | Uncommon |
| 2010-D Mount Hood | — | 1,016 | 22.6% | Uncommon |
| 2010-D Yellowstone | — | 1,119 | 24.9% | Uncommon |
| 2010-D Yosemite | — | 1,105 | 24.6% | Uncommon |
| 2010-P Grand Canyon | — | 1,051 | 23.4% | Uncommon |
| 2010-P Hot Springs | — | 1,192 | 26.5% | Uncommon |
| 2010-P Mount Hood | — | 1,121 | 24.9% | Uncommon |
| 2010-P Yellowstone | — | 1,127 | 25% | Uncommon |
| 2010-P Yosemite | — | 1,117 | 24.8% | Uncommon |
| 2010-S Grand Canyon (Proof) | — | 99 | 2.2% | Extremely scarce |
| 2010-S Grand Canyon Silver (Proof) | — | 88 | 2% | Extremely scarce |
| 2010-S Hot Springs (Proof) | — | 115 | 2.6% | Extremely scarce |
| 2010-S Hot Springs Silver (Proof) | — | 97 | 2.2% | Extremely scarce |
| 2010-S Mount Hood (Proof) | — | 99 | 2.2% | Extremely scarce |
| 2010-S Mount Hood Silver (Proof) | — | 85 | 1.9% | Extremely scarce |
| 2010-S Yellowstone (Proof) | — | 108 | 2.4% | Extremely scarce |
| 2010-S Yellowstone Silver (Proof) | — | 93 | 2.1% | Extremely scarce |
| 2010-S Yosemite (Proof) | — | 98 | 2.2% | Extremely scarce |
| 2010-S Yosemite Silver (Proof) | — | 83 | 1.8% | Extremely scarce |
| 2011-D Chickasaw | — | 1,234 | 27.4% | Uncommon |
| 2011-D Gettysburg | — | 1,008 | 22.4% | Uncommon |
| 2011-D Glacier | — | 987 | 21.9% | Scarce |
| 2011-D Olympic | — | 958 | 21.3% | Scarce |
| 2011-D Vicksburg | — | 995 | 22.1% | Scarce |
| 2011-P Chickasaw | — | 1,330 | 29.6% | Uncommon |
| 2011-P Gettysburg | — | 1,064 | 23.6% | Uncommon |
| 2011-P Glacier | — | 1,017 | 22.6% | Uncommon |
| 2011-P Olympic | — | 1,040 | 23.1% | Uncommon |
| 2011-P Vicksburg | — | 1,055 | 23.4% | Uncommon |
| 2011-S Chickasaw (Proof) | — | 88 | 2% | Extremely scarce |
| 2011-S Chickasaw Silver (Proof) | — | 72 | 1.6% | Extremely scarce |
| 2011-S Gettysburg (Proof) | — | 88 | 2% | Extremely scarce |
| 2011-S Gettysburg Silver (Proof) | — | 78 | 1.7% | Extremely scarce |
| 2011-S Glacier (Proof) | — | 88 | 2% | Extremely scarce |
| 2011-S Glacier Silver (Proof) | — | 74 | 1.6% | Extremely scarce |
| 2011-S Olympic (Proof) | — | 88 | 2% | Extremely scarce |
| 2011-S Olympic Silver (Proof) | — | 72 | 1.6% | Extremely scarce |
| 2011-S Vicksburg (Proof) | — | 87 | 1.9% | Extremely scarce |
| 2011-S Vicksburg Silver (Proof) | — | 72 | 1.6% | Extremely scarce |
| 2012-D Acadia | — | 881 | 19.6% | Scarce |
| 2012-D Chaco Culture | — | 853 | 19% | Scarce |
| 2012-D Denali | — | 1,533 | 34.1% | Common |
| 2012-D El Yunque | — | 940 | 20.9% | Scarce |
| 2012-D Hawai'i Volcanoes | — | 1,228 | 27.3% | Uncommon |
| 2012-D Hawai’i Volcanoes | — | 19 | 0.4% | Extremely scarce |
| 2012-P Acadia | — | 928 | 20.6% | Scarce |
| 2012-P Chaco Culture | — | 934 | 20.8% | Scarce |
| 2012-P Denali | — | 1,575 | 35% | Common |
| 2012-P El Yunque | — | 945 | 21% | Scarce |
| 2012-P Hawai'i Volcanoes | — | 1,161 | 25.8% | Uncommon |
| 2012-P Hawai’i Volcanoes | — | 14 | 0.3% | Extremely scarce |
| 2012-S Acadia (Proof) | — | 84 | 1.9% | Extremely scarce |
| 2012-S Acadia Silver (Proof) | — | 64 | 1.4% | Extremely scarce |
| 2012-S Chaco Culture (Proof) | — | 82 | 1.8% | Extremely scarce |
| 2012-S Chaco Culture Silver (Proof) | — | 64 | 1.4% | Extremely scarce |
| 2012-S Denali (Proof) | — | 86 | 1.9% | Extremely scarce |
| 2012-S Denali Silver (Proof) | — | 65 | 1.4% | Extremely scarce |
| 2012-S El Yunque (Proof) | — | 89 | 2% | Extremely scarce |
| 2012-S El Yunque Silver (Proof) | — | 67 | 1.5% | Extremely scarce |
| 2012-S Hawai'i Volcanoes (Proof) | — | 82 | 1.8% | Extremely scarce |
| 2012-S Hawai'i Volcanoes Silver (Proof) | — | 63 | 1.4% | Extremely scarce |
| 2012-S Acadia (Variety) | — | 74 | 1.6% | Extremely scarce |
| 2012-S Chaco Culture (Variety) | — | 76 | 1.7% | Extremely scarce |
| 2012-S Denali (Variety) | — | 81 | 1.8% | Extremely scarce |
| 2012-S El Yunque (Variety) | — | 80 | 1.8% | Extremely scarce |
| 2012-S Hawai'i Volcanoes (Variety) | — | 75 | 1.7% | Extremely scarce |
| 2013-D Fort McHenry | — | 1,453 | 32.3% | Uncommon |
| 2013-D Great Basin | — | 1,397 | 31% | Uncommon |
| 2013-D Mount Rushmore | — | 1,775 | 39.4% | Common |
| 2013-D Perry's Victory | — | 1,454 | 32.3% | Uncommon |
| 2013-D Perry’s Victory | — | 23 | 0.5% | Extremely scarce |
| 2013-D White Mountain | — | 1,375 | 30.6% | Uncommon |
| 2013-P Fort McHenry | — | 1,514 | 33.6% | Common |
| 2013-P Great Basin | — | 1,529 | 34% | Common |
| 2013-P Mount Rushmore | — | 1,873 | 41.6% | Common |
| 2013-P Perry's Victory | — | 1,466 | 32.6% | Uncommon |
| 2013-P Perry’s Victory | — | 22 | 0.5% | Extremely scarce |
| 2013-P White Mountain | — | 1,266 | 28.1% | Uncommon |
| 2013-S Fort McHenry (Proof) | — | 88 | 2% | Extremely scarce |
| 2013-S Fort McHenry Silver (Proof) | — | 63 | 1.4% | Extremely scarce |
| 2013-S Great Basin (Proof) | — | 90 | 2% | Extremely scarce |
| 2013-S Great Basin Silver (Proof) | — | 61 | 1.4% | Extremely scarce |
| 2013-S Mount Rushmore (Proof) | — | 90 | 2% | Extremely scarce |
| 2013-S Mount Rushmore Silver (Proof) | — | 65 | 1.4% | Extremely scarce |
| 2013-S Perry's Victory (Proof) | — | 92 | 2% | Extremely scarce |
| 2013-S Perry's Victory Silver (Proof) | — | 61 | 1.4% | Extremely scarce |
| 2013-S White Mountain (Proof) | — | 92 | 2% | Extremely scarce |
| 2013-S White Mountain Silver (Proof) | — | 61 | 1.4% | Extremely scarce |
| 2013-S Fort McHenry (Variety) | — | 69 | 1.5% | Extremely scarce |
| 2013-S Great Basin (Variety) | — | 72 | 1.6% | Extremely scarce |
| 2013-S Mount Rushmore (Variety) | — | 70 | 1.6% | Extremely scarce |
| 2013-S Perry's Victory (Variety) | — | 69 | 1.5% | Extremely scarce |
| 2013-S White Mountain (Variety) | — | 82 | 1.8% | Extremely scarce |
| 2014-D Arches | — | 1,702 | 37.8% | Common |
| 2014-D Everglades | — | 1,449 | 32.2% | Uncommon |
| 2014-D Great Sand Dunes | — | 1,443 | 32.1% | Uncommon |
| 2014-D Great Smoky Mountains | — | 1,390 | 30.9% | Uncommon |
| 2014-D Kisatchie | — | 1 | 0% | Extremely scarce |
| 2014-D Shenandoah | — | 1,582 | 35.2% | Common |
| 2014-P Arches | — | 1,666 | 37% | Common |
| 2014-P Everglades | — | 1,594 | 35.4% | Common |
| 2014-P Great Sand Dunes | — | 1,528 | 34% | Common |
| 2014-P Great Smoky Mountains | — | 1,297 | 28.8% | Uncommon |
| 2014-P Shenandoah | — | 1,476 | 32.8% | Uncommon |
| 2014-S Arches (Proof) | — | 82 | 1.8% | Extremely scarce |
| 2014-S Arches Silver (Proof) | — | 61 | 1.4% | Extremely scarce |
| 2014-S Everglades (Proof) | — | 80 | 1.8% | Extremely scarce |
| 2014-S Everglades Silver (Proof) | — | 61 | 1.4% | Extremely scarce |
| 2014-S Great Sand Dunes (Proof) | — | 88 | 2% | Extremely scarce |
| 2014-S Great Sand Dunes Silver (Proof) | — | 57 | 1.3% | Extremely scarce |
| 2014-S Great Smoky Mountains (Proof) | — | 81 | 1.8% | Extremely scarce |
| 2014-S Great Smoky Mountains Silver (Proof) | — | 65 | 1.4% | Extremely scarce |
| 2014-S Shenandoah (Proof) | — | 81 | 1.8% | Extremely scarce |
| 2014-S Shenandoah Silver (Proof) | — | 62 | 1.4% | Extremely scarce |
| 2014-S Arches (Variety) | — | 66 | 1.5% | Extremely scarce |
| 2014-S Everglades (Variety) | — | 65 | 1.4% | Extremely scarce |
| 2014-S Great Sand Dunes (Variety) | — | 70 | 1.6% | Extremely scarce |
| 2014-S Great Smoky Mountains (Variety) | — | 73 | 1.6% | Extremely scarce |
| 2014-S Shenandoah (Variety) | — | 68 | 1.5% | Extremely scarce |
| 2015-D Blue Ridge Parkway | — | 1,986 | 44.1% | Common |
| 2015-D Bombay Hook | — | 1,585 | 35.2% | Common |
| 2015-D Homestead | — | 1,751 | 38.9% | Common |
| 2015-D Kisatchie | — | 1,857 | 41.3% | Common |
| 2015-D Saratoga | — | 1,647 | 36.6% | Common |
| 2015-P Blue Ridge Parkway | — | 1,772 | 39.4% | Common |
| 2015-P Bombay Hook | — | 1,811 | 40.2% | Common |
| 2015-P Homestead | — | 1,678 | 37.3% | Common |
| 2015-P Kisatchie | — | 1,922 | 42.7% | Common |
| 2015-P Saratoga | — | 1,705 | 37.9% | Common |
| 2015-S Blue Ridge Parkway (Proof) | — | 85 | 1.9% | Extremely scarce |
| 2015-S Blue Ridge Parkway Silver (Proof) | — | 58 | 1.3% | Extremely scarce |
| 2015-S Bombay Hook (Proof) | — | 76 | 1.7% | Extremely scarce |
| 2015-S Bombay Hook Silver (Proof) | — | 57 | 1.3% | Extremely scarce |
| 2015-S Homestead (Proof) | — | 80 | 1.8% | Extremely scarce |
| 2015-S Homestead Silver (Proof) | — | 56 | 1.2% | Extremely scarce |
| 2015-S Kisatchie (Proof) | — | 80 | 1.8% | Extremely scarce |
| 2015-S Kisatchie Silver (Proof) | — | 57 | 1.3% | Extremely scarce |
| 2015-S Saratoga (Proof) | — | 79 | 1.8% | Extremely scarce |
| 2015-S Saratoga Silver (Proof) | — | 52 | 1.2% | Extremely scarce |
| 2015-S Blue Ridge Parkway (Variety) | — | 70 | 1.6% | Extremely scarce |
| 2015-S Bombay Hook (Variety) | — | 63 | 1.4% | Extremely scarce |
| 2015-S Homestead (Variety) | — | 65 | 1.4% | Extremely scarce |
| 2015-S Kisatchie (Variety) | — | 70 | 1.6% | Extremely scarce |
| 2015-S Saratoga (Variety) | — | 69 | 1.5% | Extremely scarce |
| 2016-D Cumberland Gap | — | 1,647 | 36.6% | Common |
| 2016-D Fort Moultrie | — | 1,430 | 31.8% | Uncommon |
| 2016-D Harpers Ferry | — | 1,904 | 42.3% | Common |
| 2016-D Shawnee | — | 1,442 | 32% | Uncommon |
| 2016-D Theodore Roosevelt | — | 1,679 | 37.3% | Common |
| 2016-P Cumberland Gap | — | 1,664 | 37% | Common |
| 2016-P Fort Moultrie | — | 1,523 | 33.8% | Common |
| 2016-P Harpers Ferry | — | 1,891 | 42% | Common |
| 2016-P Shawnee | — | 1,495 | 33.2% | Uncommon |
| 2016-P Theodore Roosevelt | — | 1,666 | 37% | Common |
| 2016-S Cumberland Gap (Proof) | — | 66 | 1.5% | Extremely scarce |
| 2016-S Cumberland Gap Silver (Proof) | — | 53 | 1.2% | Extremely scarce |
| 2016-S Fort Moultrie (Proof) | — | 66 | 1.5% | Extremely scarce |
| 2016-S Fort Moultrie Silver (Proof) | — | 48 | 1.1% | Extremely scarce |
| 2016-S Harpers Ferry (Proof) | — | 71 | 1.6% | Extremely scarce |
| 2016-S Harpers Ferry Silver (Proof) | — | 55 | 1.2% | Extremely scarce |
| 2016-S Shawnee (Proof) | — | 73 | 1.6% | Extremely scarce |
| 2016-S Shawnee Silver (Proof) | — | 53 | 1.2% | Extremely scarce |
| 2016-S Theodore Roosevelt (Proof) | — | 69 | 1.5% | Extremely scarce |
| 2016-S Theodore Roosevelt Silver (Proof) | — | 50 | 1.1% | Extremely scarce |
| 2016-S Cumberland Gap (Variety) | — | 70 | 1.6% | Extremely scarce |
| 2016-S Fort Moultrie (Variety) | — | 60 | 1.3% | Extremely scarce |
| 2016-S Harpers Ferry (Variety) | — | 68 | 1.5% | Extremely scarce |
| 2016-S Shawnee (Variety) | — | 71 | 1.6% | Extremely scarce |
| 2016-S Theodore Roosevelt (Variety) | — | 70 | 1.6% | Extremely scarce |
| 2017-D Effigy Mounds | — | 1,683 | 37.4% | Common |
| 2017-D Ellis Island | — | 1,644 | 36.5% | Common |
| 2017-D Frederick Douglass | — | 1,605 | 35.7% | Common |
| 2017-D George Rogers Clark | — | 1,534 | 34.1% | Common |
| 2017-D Ozark Riverways | — | 1,578 | 35.1% | Common |
| 2017-P Effigy Mounds | — | 1,720 | 38.2% | Common |
| 2017-P Ellis Island | — | 1,677 | 37.3% | Common |
| 2017-P Frederick Douglass | — | 1,549 | 34.4% | Common |
| 2017-P George Rogers Clark | — | 1,608 | 35.7% | Common |
| 2017-P Ozark Riverways | — | 1,685 | 37.4% | Common |
| 2017-S Effigy Mounds (Proof) | — | 77 | 1.7% | Extremely scarce |
| 2017-S Effigy Mounds Silver (Proof) | — | 55 | 1.2% | Extremely scarce |
| 2017-S Ellis Island (Proof) | — | 70 | 1.6% | Extremely scarce |
| 2017-S Ellis Island Silver (Proof) | — | 53 | 1.2% | Extremely scarce |
| 2017-S Frederick Douglass (Proof) | — | 71 | 1.6% | Extremely scarce |
| 2017-S Frederick Douglass Silver (Proof) | — | 55 | 1.2% | Extremely scarce |
| 2017-S George Rogers Clark (Proof) | — | 70 | 1.6% | Extremely scarce |
| 2017-S George Rogers Clark Silver (Proof) | — | 59 | 1.3% | Extremely scarce |
| 2017-S Ozark Riverways (Proof) | — | 71 | 1.6% | Extremely scarce |
| 2017-S Ozark Riverways Silver (Proof) | — | 55 | 1.2% | Extremely scarce |
| 2017-S Effigy Mounds (Variety) | — | 73 | 1.6% | Extremely scarce |
| 2017-S Ellis Island (Variety) | — | 76 | 1.7% | Extremely scarce |
| 2017-S Frederick Douglass (Variety) | — | 78 | 1.7% | Extremely scarce |
| 2017-S George Rogers Clark (Variety) | — | 76 | 1.7% | Extremely scarce |
| 2017-S Ozark Riverways (Variety) | — | 74 | 1.6% | Extremely scarce |
| 2018-D Apostle Islands | — | 1,613 | 35.8% | Common |
| 2018-D Block Island | — | 1,428 | 31.7% | Uncommon |
| 2018-D Cumberland Island | — | 1,406 | 31.2% | Uncommon |
| 2018-D Pictured Rocks | — | 1,528 | 34% | Common |
| 2018-D Voyageurs | — | 1,567 | 34.8% | Common |
| 2018-P Apostle Islands | — | 1,703 | 37.8% | Common |
| 2018-P Block Island | — | 1,449 | 32.2% | Uncommon |
| 2018-P Cumberland Island | — | 1,464 | 32.5% | Uncommon |
| 2018-P Pictured Rocks | — | 1,557 | 34.6% | Common |
| 2018-P Voyageurs | — | 1,714 | 38.1% | Common |
| 2018-S Apostle Islands (Proof) | — | 69 | 1.5% | Extremely scarce |
| 2018-S Apostle Islands Silver (Proof) | — | 65 | 1.4% | Extremely scarce |
| 2018-S Block Island (Proof) | — | 74 | 1.6% | Extremely scarce |
| 2018-S Block Island Silver (Proof) | — | 61 | 1.4% | Extremely scarce |
| 2018-S Cumberland Island (Proof) | — | 73 | 1.6% | Extremely scarce |
| 2018-S Cumberland Island Silver (Proof) | — | 65 | 1.4% | Extremely scarce |
| 2018-S Pictured Rocks (Proof) | — | 71 | 1.6% | Extremely scarce |
| 2018-S Pictured Rocks Silver (Proof) | — | 67 | 1.5% | Extremely scarce |
| 2018-S Voyageurs (Proof) | — | 75 | 1.7% | Extremely scarce |
| 2018-S Voyageurs Silver (Proof) | — | 65 | 1.4% | Extremely scarce |
| 2018-S Apostle Islands (Variety) | — | 65 | 1.4% | Extremely scarce |
| 2018-S Block Island (Variety) | — | 62 | 1.4% | Extremely scarce |
| 2018-S Cumberland Island (Variety) | — | 62 | 1.4% | Extremely scarce |
| 2018-S Pictured Rocks (Variety) | — | 63 | 1.4% | Extremely scarce |
| 2018-S Voyageurs (Variety) | — | 64 | 1.4% | Extremely scarce |
| 2019-D American Memorial Park | — | 1,533 | 34.1% | Common |
| 2019-D Lowell | — | 1,523 | 33.8% | Common |
| 2019-D River of No Return | — | 1,571 | 34.9% | Common |
| 2019-D San Antonio Missions | — | 1,357 | 30.2% | Uncommon |
| 2019-D War in the Pacific | — | 1,307 | 29% | Uncommon |
| 2019-P American Memorial Park | — | 1,489 | 33.1% | Uncommon |
| 2019-P Lowell | — | 1,529 | 34% | Common |
| 2019-P River of No Return | — | 1,607 | 35.7% | Common |
| 2019-P San Antonio Missions | — | 1,549 | 34.4% | Common |
| 2019-P War in the Pacific | — | 1,393 | 31% | Uncommon |
| 2019-S American Memorial Park (Proof) | — | 86 | 1.9% | Extremely scarce |
| 2019-S American Memorial Park Silver (Proof) | — | 67 | 1.5% | Extremely scarce |
| 2019-S Lowell (Proof) | — | 94 | 2.1% | Extremely scarce |
| 2019-S Lowell Silver (Proof) | — | 72 | 1.6% | Extremely scarce |
| 2019-S River of No Return (Proof) | — | 86 | 1.9% | Extremely scarce |
| 2019-S River of No Return Silver (Proof) | — | 67 | 1.5% | Extremely scarce |
| 2019-S San Antonio Missions (Proof) | — | 88 | 2% | Extremely scarce |
| 2019-S San Antonio Missions Silver (Proof) | — | 65 | 1.4% | Extremely scarce |
| 2019-S War in the Pacific (Proof) | — | 92 | 2% | Extremely scarce |
| 2019-S War in the Pacific Silver (Proof) | — | 65 | 1.4% | Extremely scarce |
| 2019-S American Memorial Park (Variety) | — | 77 | 1.7% | Extremely scarce |
| 2019-S Lowell (Variety) | — | 70 | 1.6% | Extremely scarce |
| 2019-S River of No Return (Variety) | — | 70 | 1.6% | Extremely scarce |
| 2019-S San Antonio Missions (Variety) | — | 73 | 1.6% | Extremely scarce |
| 2019-S War in the Pacific (Variety) | — | 77 | 1.7% | Extremely scarce |
| 2019-W American Memorial Park | — | 490 | 10.9% | Very scarce |
| 2019-W Lowell | — | 608 | 13.5% | Scarce |
| 2019-W River of No Return | — | 479 | 10.6% | Very scarce |
| 2019-W San Antonio Missions | — | 500 | 11.1% | Very scarce |
| 2019-W War in the Pacific | — | 512 | 11.4% | Scarce |
| 2020-D Marsh-Billings-Rockefeller | — | 1,763 | 39.2% | Common |
| 2020-D National Park | — | 1,610 | 35.8% | Common |
| 2020-D Salt River Bay | — | 1,909 | 42.4% | Common |
| 2020-D Tallgrass Prairie | — | 1,318 | 29.3% | Uncommon |
| 2020-D Weir Farm | — | 1,437 | 31.9% | Uncommon |
| 2020-P Marsh-Billings-Rockefeller | — | 1,695 | 37.7% | Common |
| 2020-P National Park | — | 1,770 | 39.3% | Common |
| 2020-P Salt River Bay | — | 1,914 | 42.5% | Common |
| 2020-P Talgrass Prairie | — | 1 | 0% | Extremely scarce |
| 2020-P Tallgrass Prairie | — | 1,295 | 28.8% | Uncommon |
| 2020-P Weir Farm | — | 1,384 | 30.8% | Uncommon |
| 2020-S Marsh-Billings-Rockefeller (Proof) | — | 76 | 1.7% | Extremely scarce |
| 2020-S Marsh-Billings-Rockefeller Silver (Proof) | — | 66 | 1.5% | Extremely scarce |
| 2020-S National Park (Proof) | — | 79 | 1.8% | Extremely scarce |
| 2020-S National Park Silver (Proof) | — | 68 | 1.5% | Extremely scarce |
| 2020-S Salt River Bay (Proof) | — | 76 | 1.7% | Extremely scarce |
| 2020-S Salt River Bay Silver (Proof) | — | 68 | 1.5% | Extremely scarce |
| 2020-S Tallgrass Prairie (Proof) | — | 79 | 1.8% | Extremely scarce |
| 2020-S Tallgrass Prairie Silver (Proof) | — | 68 | 1.5% | Extremely scarce |
| 2020-S Weir Farm (Proof) | — | 80 | 1.8% | Extremely scarce |
| 2020-S Weir Farm Silver (Proof) | — | 65 | 1.4% | Extremely scarce |
| 2020-S Marsh-Billings-Rockefeller (Variety) | — | 70 | 1.6% | Extremely scarce |
| 2020-S National Park (Variety) | — | 82 | 1.8% | Extremely scarce |
| 2020-S Salt River Bay (Variety) | — | 73 | 1.6% | Extremely scarce |
| 2020-S Tallgrass Prairie (Variety) | — | 70 | 1.6% | Extremely scarce |
| 2020-S Weir Farm (Variety) | — | 65 | 1.4% | Extremely scarce |
| 2020-W Marsh-Billings-Rockefeller | — | 470 | 10.4% | Very scarce |
| 2020-W National Park | — | 532 | 11.8% | Scarce |
| 2020-W Salt River Bay | — | 540 | 12% | Scarce |
| 2020-W Tallgrass Prairie | — | 495 | 11% | Very scarce |
| 2020-W Weir Farm | — | 497 | 11% | Very scarce |
| 2021-D Tuskegee Airmen | — | 1,697 | 37.7% | Common |
| 2021-P Tuskegee Airmen | — | 1,395 | 31% | Uncommon |
| 2021-S Tuskegee Airmen (Proof) | — | 92 | 2% | Extremely scarce |
| 2021-S Tuskegee Airmen Silver (Proof) | — | 73 | 1.6% | Extremely scarce |
| 2021-S Tuskegee Airmen (Variety) | — | 73 | 1.6% | Extremely scarce |
| 2021-W Tuskegee Airmen | — | 2 | 0% | Extremely scarce |
- Common
- Uncommon
- Scarce
- Very scarce
- Extremely scarce
Based on the share of this set's collectors who own each coin — how often it turns up in a collection, not how many survive. Not the Sheldon rarity scale.
About these numbers
Ownership counts come from the same live per-coin counters shown across the LuckyCoin catalog; set-level collector counts come from the annual full-collection scan behind The State of Coin Collecting 2026. Counts are collector-reported and aggregate-only. Scarcity tiers come from 100 × (1 − owners ÷ owners of the set's most-owned coin): Common under 25, Uncommon 25–49, Scarce 50–74, Very scarce 75–89, Extremely scarce 90+. This reflects how often a coin is collected, not its surviving population — it is not the Sheldon rarity scale. CC BY 4.0 with attribution.